
Introduction
In the second part of my series on accessibility testing, I want to highlight a tool that sits along the Accessibility Insights Tool For Web tool that we explored earlier.
As a developer, it's not often I get excited about testing tools. I hope, as the reader, you'll understand by the end of this article why the "Test and Feedback" extension is another tool that needs to be considered. Not only is it something to explore when detailing the accessibility issues that can not be found by automated testing, but also, more broadly, it supports exploitive testing.

The test and feedback extension supports the automatic capture of data that we, as developers, often ask for when reproducing issues; data like:
- The exact page the issue was found on.
- What device, browser, or operating system was being tested.
- How much memory was left can help in some circumstances.
As Microsoft says the test and feedback extension allows testers of web apps to "give feedback directly from the browser on any platform".
Installation
The extension is available for Chrome, Firefox and Edge on Windows, Mac or Linux.
To install "Test and Feedback", visit the Test and Feedback page on the Microsoft Visual Studio Marketplace.
Configuration
Test and feedback work in two modes, "connected" and "standalone". Note a mode can only be selected if a testing session is not running.
Standalone Mode
In standalone mode, the test and feedback extension is not connected to Azure DevOps. In standalone mode, some functionality is not available to the user. Standalone mode is the default mode when the extension is installed.
Connected Mode
In connected mode, the test and feedback extension is connected to Azure DevOps. In connected mode all functionality is available to the user.
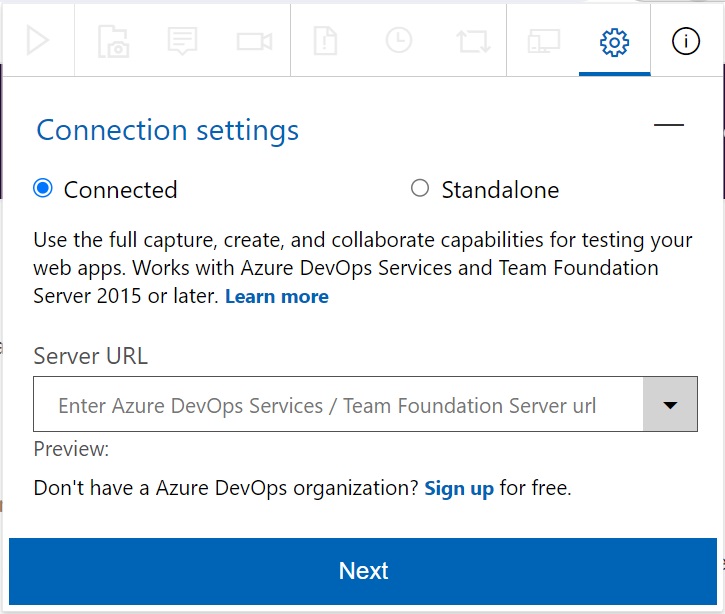
To configure connected mode, link it to Azure DevOps via the cog at the top right of the extension; screen reader users will hear "Configure Connection Settings" when they navigate to the cog. In it's current iteration it's not possible to use the keyboard to tab between "Connected" and "Standalone" options.
In the server URL box enter the URL for your Azure DevOps organisation once this has been entered you will be asked to select the team you wish to log test cases too.
Starting and stopping a testing session
When open the test and feedback extension displays a toolbar.
The first icon in the toolbar is a play button, initially labelled "Session stopped. Select to start". Clicking this button starts the testing session. When clicked, the icon becomes a square, and the label is changed to "Session running. Menus are activated. Select to stop".
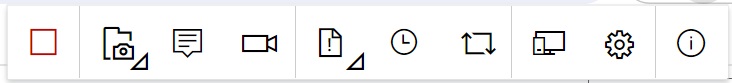
Capture Application
The capture application option allows the user to capture:
- A shot of the browser
- A shot of the screen
- A shot of the application
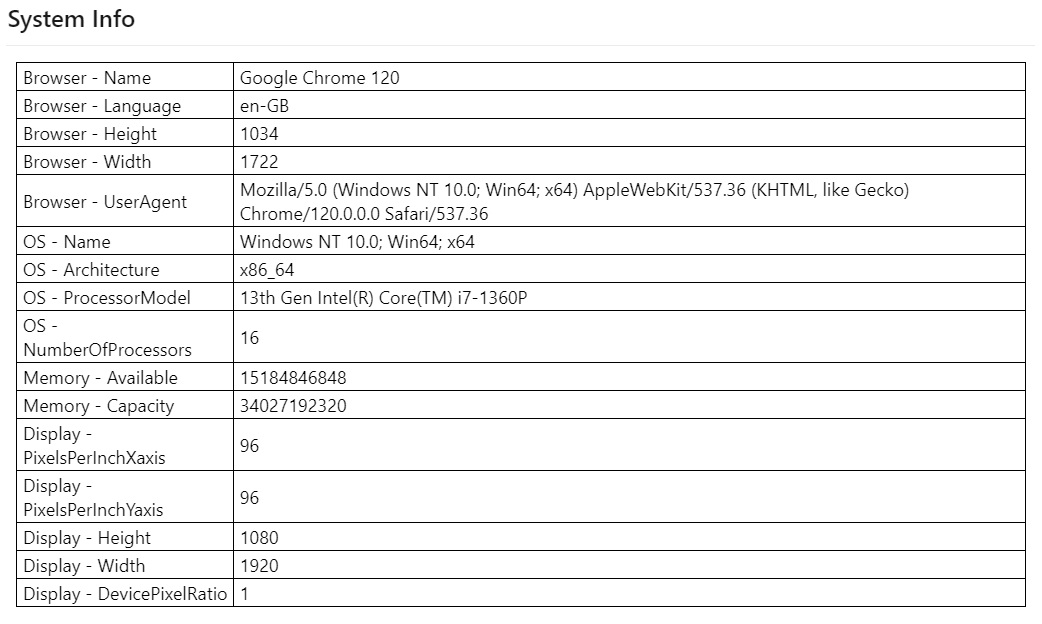
If, as part of the session, you navigate to a page, page load stats, similar to the lighthouse stats, can be automatically added to the work item that is being filed, an example report can be found in this GitHub repository .
As well as the URL for the issue the work item will also automatically include:
- Brower details - name, language, height, width
- UserAgent
- Operating System details - name, architecture, processor model and number of processors
- Memory - availability and capacity
- Display details - Pixels Per Inch X and Y axis, height, width and the device pixel ratio.
All the information you would ask a user for when they file a bug or an issue (and more).
The capture application options all allow the tester to add notes to the screenshot via a popup menu as shown below:

This includes:
- The file name to use
- Drawing with a circle or a square
- Adding an arrow
- Adding text
- Redacting information
- Deleting the item added
There is also tick box at the end of the menu to save the image, and a cross to cancel out.
Adding to an existing bug is also possible; more information on this is available from Microsoft: "Add findings to existing bugs with exploratory testing".
Additional Actions
The remaining items in the test and feedback extension are:
- Adding notes - this allows the user to add additional notes to the screenshot that has just been made.
- Record screen - this allows the user to record videos of the screen, with a voiceover for up to ten minutes at a time.
- Create test case - Once issues have been captured it is possible to use these to create bugs, tasks or test cases within Azure DevOps.
- View session timeline - this reports all activity completed within the session.
- Explore work items to link - as well as pushing bugs and issues to Azure DevOps, work items in Azure DevOps can be pushed to the test and feedback tool, more information is available from Microsoft, "explore work items with the Test & Feedback extension".
- Connect to a device - this is the "upsell option" that allows the user to connect the testing to Perfecto for device testing. As the link provided returns a 404. I am unable to document or test this functionality.
Standalone Mode: Reduced Functionality
The following options are not available in standalone mode:
- Record screen.
- Explore work items.
- Connect to a device.
In addition, when creating bugs, the ability to file tasks and create test cases has been removed, which makes sense as this is functionality available in Azure DevOps.
In standalone mode when the session is stopped a HTML report is available which details all the bugs and attachments filed as part of the session.
Digital Agency and Multi-Project Support
Security is managed by the user of the extension logging into their Azure DevOps account in their browser and then selecting the team they belong to, to log tickets against.
As with the "Accessibility Insights For Web Extension" whilst this does make logging tickets easy, if it is being used in a multi-project environment, it is important to remember to check the URL and the team the extension is logging issues to before starting exploratory testing with this tool to ensure that the tickets are logged to the correct repository or Azure DevOps board.
Summary
As you can probably tell from the level of detail on this blog, the Test and Feedback tool is a great tool to support both exploratory testing and accessibility testing. The reason as a developer I like this tool is because it captures all the data that developers ask for (and more) about the environment a user is working with when they raise an issue. It also has the note-taking and redact options when capturing screenshots, making it easy to capture notes and redact sensitive information.
This is definitely a tool to consider as part of the testing and development experience.